HITEC City to Financial District: A Real Estate Growth Story
Quick Answer
Hyderabad’s tech corridor, stretching from HITEC City through Gachibowli to the Financial District, has grown into an established office and residential market. Strong IT and GCC activity continues to support housing demand, but higher property prices already reflect much of this growth. Buyers should weigh the convenience of living near work against the premium they pay.
Why do so many Hyderabad home-buyers, from young tech professionals to NRIs planning a return, keep hearing the same advice: “Just buy somewhere in the corridor”?
The phrase sounds simple, yet it hides a real story. Over the years, a long stretch of west Hyderabad turned into one of the country’s busiest office markets. Companies leased campuses first, and then people looked for homes close enough to make the daily drive bearable. Gradually, apartments, schools, and hospitals filled the gaps between the offices.
For buyers in their 30s to 50s, this matters in two ways. First, this guide explains why homes here hold steady demand. Second, it explains why they cost more, since buyers are now entering an established market rather than an undiscovered one. This guide maps the corridor, walks through the 2026 numbers, explains how housing followed jobs, and shows how a buyer can use this story wisely.
Live Where You Work | Spacious 3 BHKs in the Heart of the Financial District| Ready to move-in | From ₹1.99 Cr .
What “HITEC City to Financial District” Actually Is
The tech corridor is not a single pin code. Instead, it works as one long labour market, with several connected nodes along the way.
| Node | Its role in the corridor |
|---|---|
| HITEC City, Madhapur, Raidurg | The original IT hub, where the Blue Line metro ends at Raidurg |
| Kondapur | The residential and commercial fabric linking the nodes |
| Gachibowli | An older, mixed node of offices and homes |
| Nanakramguda and the Financial District | The newer end, heavy on large office campuses and apartments |
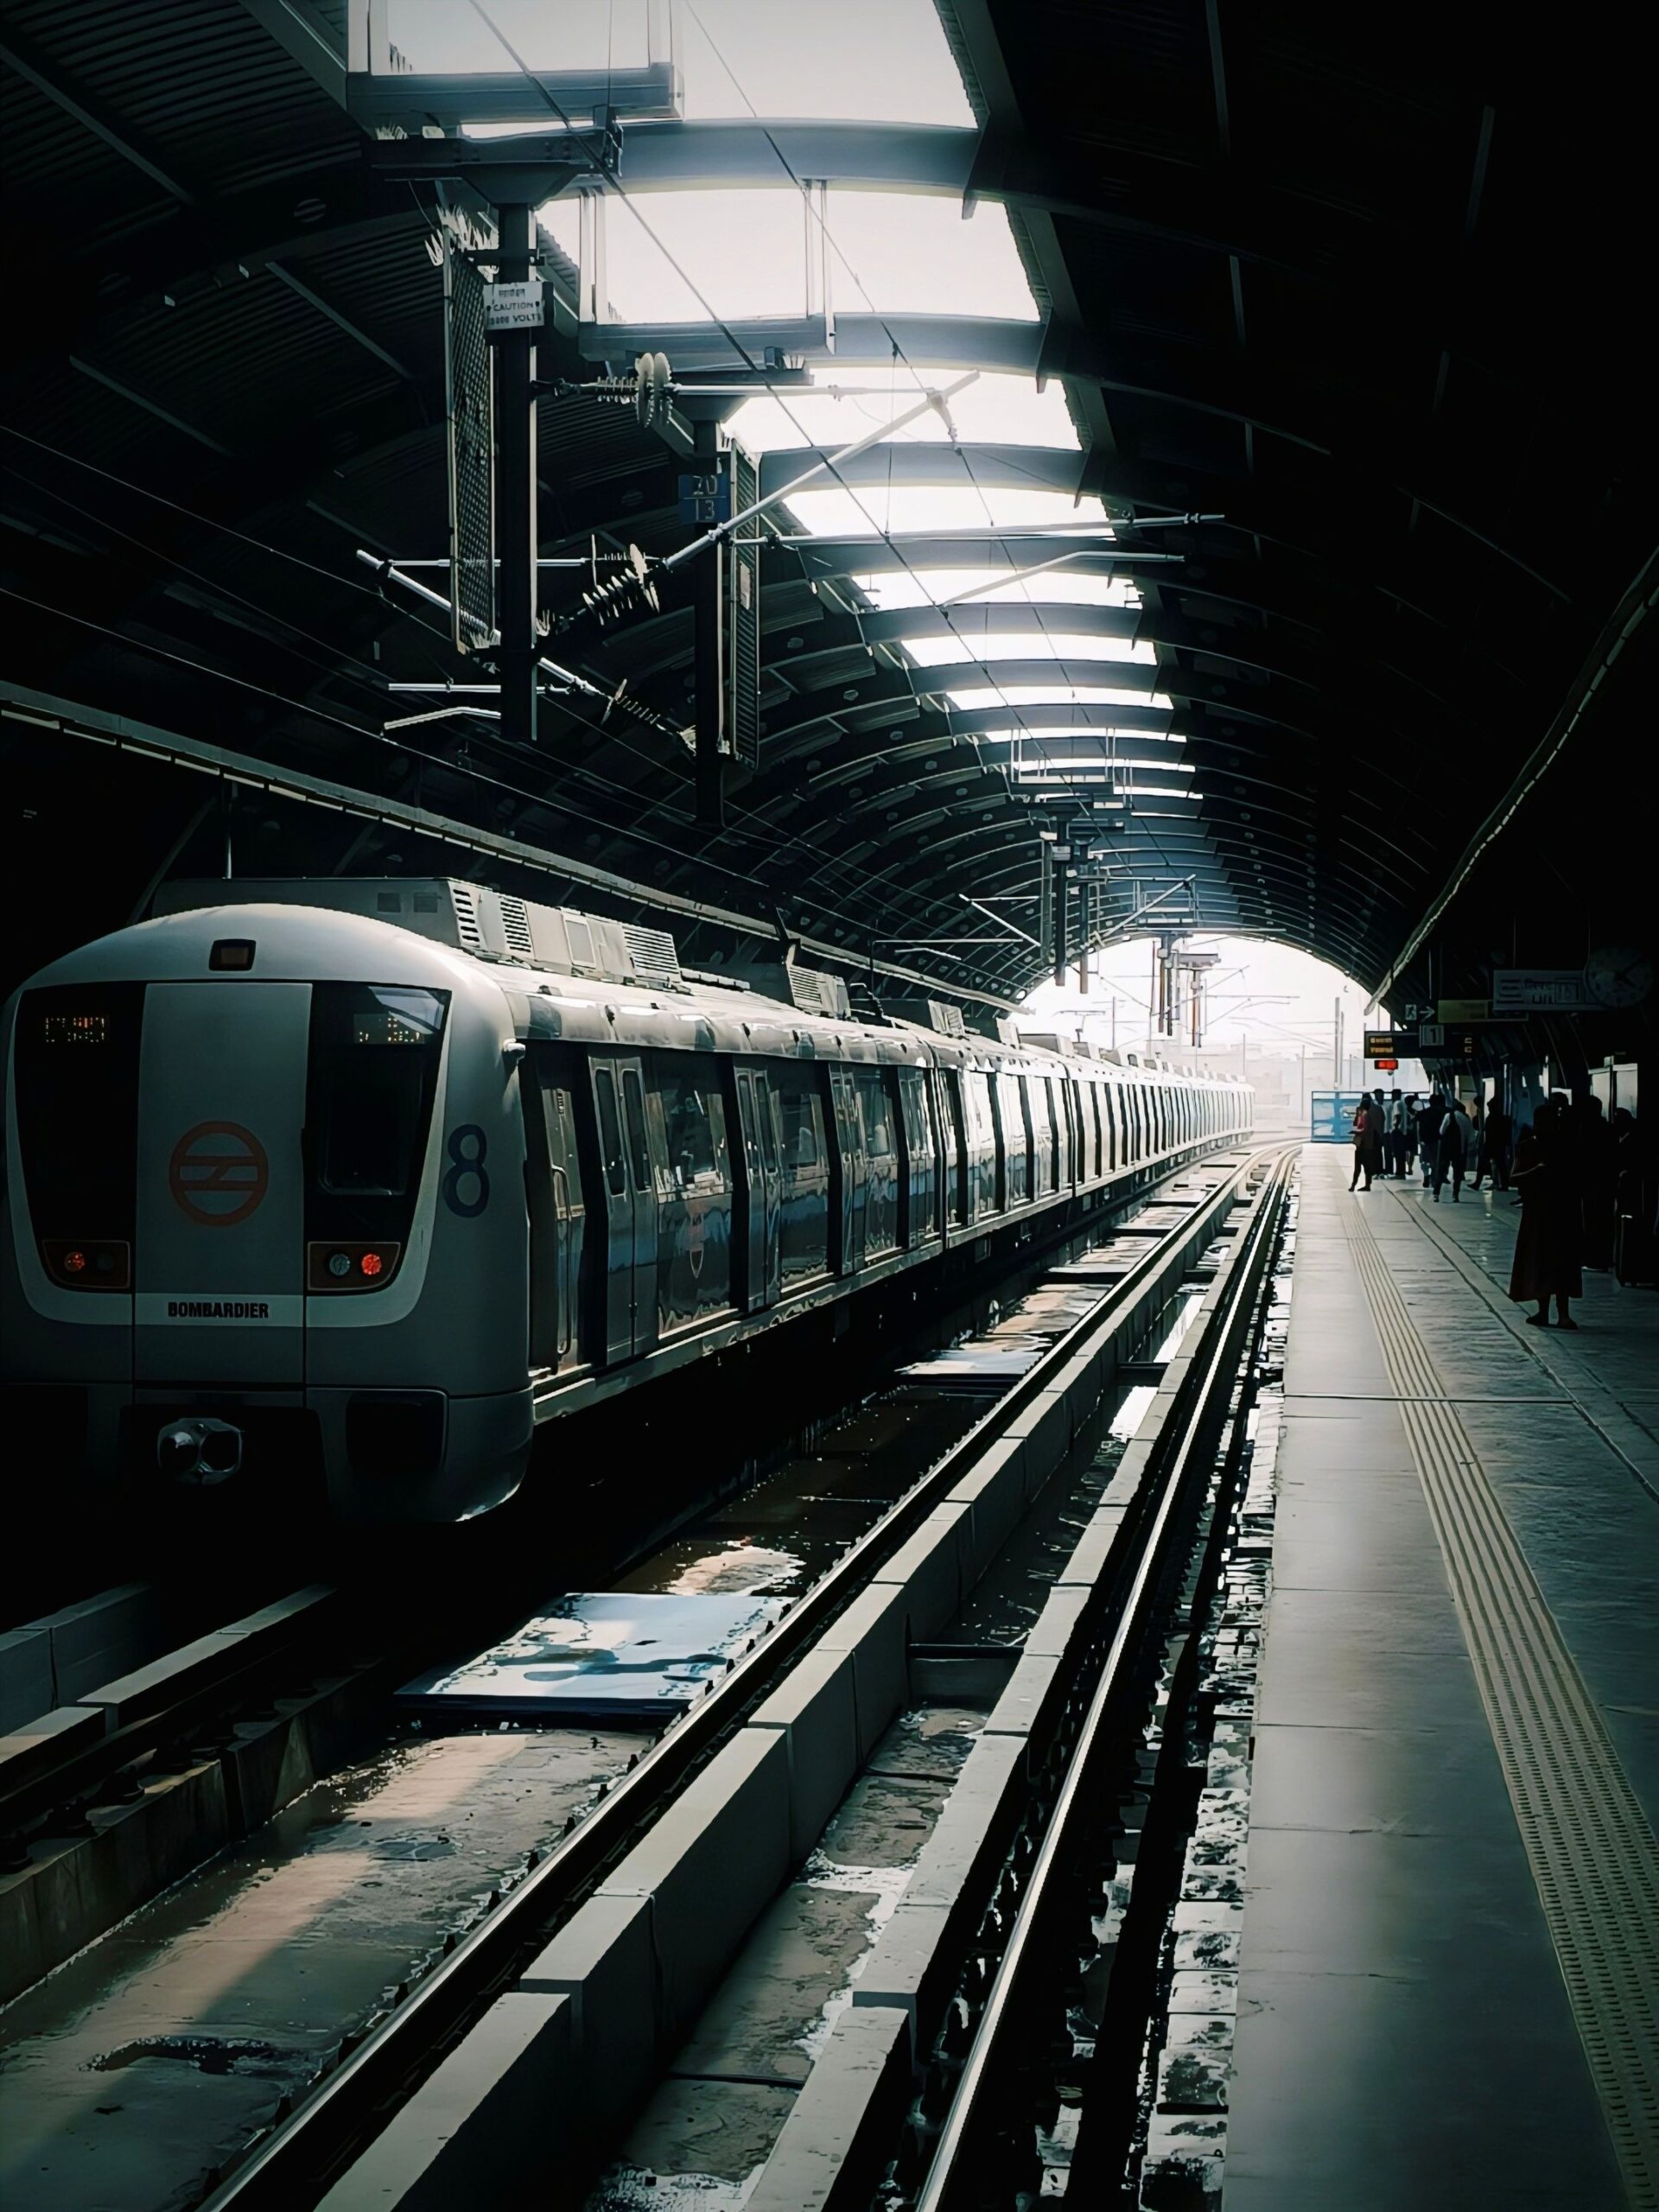
HITEC City, along with Madhapur and Raidurg, forms the corridor’s starting point. Commuters can use the Blue Line’s Raidurg metro station here, which makes this end the only part of the corridor with a running metro today. Moving west, Kondapur connects the offices with dense housing and daily services. Gachibowli then follows as a long-established node, where offices and homes grew up side by side. Finally, Nanakramguda and the Financial District complete the spine, with large campuses and newer apartment communities. Much of this belt falls within the Cyberabad area.
Kokapet and Narsingi sit nearby, on the edge of the same western market near the Outer Ring Road. However, they form the ring of this west rather than the end point of the HITEC City to Financial District story.
Taken together, these areas share one reality: many residents work somewhere along the same spine. A professional who lives in Kondapur might work in the Financial District, while a neighbor commutes to HITEC City. In this sense, buyers treat the corridor as one commute zone, even though each node has its own character.
The Office Numbers That Still Feed the Housing Story
Offices drive this corridor, so the office numbers explain why housing demand remains strong. The report offers a clear picture from sources like Knight frank .
| Office indicator (Hyderabad, H1 2026) | Figure |
|---|---|
| Office space transacted | 7.5 million sq ft, up 29% year on year |
| Share of leasing by Global Capability Centres (GCCs) | 45% |
| Share of leasing in the Suburban Business District (SBD) | 60% |
| Share of leasing in the Peripheral Business District West | 36% |
| Vacancy | 11.5% |
| Average transacted rent | ₹80 per sq ft per month |
According to Knight Frank, the Suburban Business District covers Kondapur, Raidurg, HITEC City, and the Financial District, while the Peripheral Business District West includes Nanakramguda. This has also been described this as Hyderabad’s highest first-half leasing on its record.
A simple calculation from these figures: 60% of 7.5 million sq ft equals about 4.5 million sq ft leased in the SBD. Similarly, 36% equals about 2.7 million sq ft in the PBD West. Together, these two zones account for about 96% of the city’s office leasing in the period. Meanwhile, GCCs alone took about 3.4 million sq ft.
These numbers show why end users continue to buy homes here, even when hiring headlines wobble. Large employers keep committing to long-term office space along this spine, and their employees need homes nearby.(Sources)
Other research firms measure the market differently. JLL, for instance, reported 5.38 million sq ft for Hyderabad in H1 2026 using its own method. Its data also showed Gachibowli taking about half of leasing and HITEC City about a third.
Why Homes Followed the Campuses
The housing story in west Hyderabad began with a simple wish: a shorter commute. As offices opened around HITEC City and later Gachibowli and the Financial District, employees looked for homes close to work. Developers responded by building on open land between the campuses. Over time, apartments filled the gaps, and the area grew into a complete residential market.
Knight Frank’s report 2026 numbers show how strong that pull remains.
| Residential indicator (Hyderabad, H1 2026) | Figure |
|---|---|
| Homes sold | 19,249, up 1% year on year |
| New launches | 20,466, down 2% year on year |
| West Hyderabad’s share of sales | 63% |
| West Hyderabad’s share of launches | 61% |
| City average price | ₹8,258 per sq ft, up 7% year on year |
A simple calculation from these figures: 63% of 19,249 homes means roughly 12,100 homes sold in west Hyderabad in just six months. Likewise, 61% of launches equals about 12,500 new homes entering the western market.
In reports on the same data, ET Realty named localities such as Kukatpally, Madhapur, Kondapur, Gachibowli, Raidurgam, and Kokapet among those driving west Hyderabad’s activity. Knight Frank also linked the demand mainly to end users and to tech and GCC employment.
This depth of demand brings practical benefits. A busy market usually means more buyers when an owner wants to sell, and more tenants when an owner wants to rent. ASBL’s guide to the Hyderabad real estate market explores the investment side in more detail.
Over time, daily infrastructure followed the residents as well. Large hospitals such as AIG in Gachibowli and Continental in Nanakramguda now serve the area, along with many schools. As a result, families can live, work, and access care within the same belt.(Source)
What 2026 Prices Already Know
A strong growth story does not mean a low price. In fact, the opposite often holds true.
Knight Frank’s citywide average of ₹8,258 per sq ft includes every part of Hyderabad, from premium areas to more affordable ones. Homes along this corridor generally cost more than that average, since buyers pay for proximity to an established job centre. In simple terms, today’s buyers are not discovering this corridor. Instead, they are paying for a market that has already matured, with its jobs, roads, and services in place. That maturity brings stability and convenience, yet it also means much of the past growth already sits in the price.
Traffic forms part of this picture too. Peak-hour drives towards HITEC City can be slow, so living “in the corridor” does not guarantee a short commute. ASBL’s guide on life inside the ORR versus just outside it explains how daily routines differ.
The metro story needs care as well. Commuters can board the Blue Line at Raidurg today, which helps residents near the HITEC City end. However, Nanakramguda and the Financial District still rely on road travel. The proposed Phase 2 Corridor V extension from Raidurg to Kokapet Neopolis remains a proposal, as ASBL’s article on Hyderabad Metro Phase 2 explains.
How to Use This Story Without Buying the Brochure
The corridor’s growth story helps buyers understand the market, but it should not replace their own judgement. Two kinds of buyers usually come to this area, and each needs a different lens.
| Buyer type | What the corridor offers | What to keep in mind |
|---|---|---|
| Works along the spine | A shorter commute and established services | The convenience already shows in the price |
| Looking for the next big price rise | A mature, stable market | Newer growth areas lie further out, covered in a separate guide |
Buyers who work along the corridor and can comfortably afford the EMI gain real daily value here. In contrast, buyers who mainly want the next major price rise may need to look elsewhere. ASBL’s article on Hyderabad’s office boom and the next housing hot-spot covers those outer areas, while the comparison of Gachibowli vs HITEC City and the guide on Financial District investment look at individual locations.
Before booking a home here, a buyer can run through a short checklist:
- Time the commute. Drive from the project gate to the office at 8:30 am on a weekday.
- Compare the metro and the car. Check whether Raidurg station fits the daily route, or whether the drive works better.
- Verify the project. Confirm the TGRERA registration and its details.
- Check the occupancy certificate. For ready-to-move homes, confirm that the OC exists.
Buyers can reach out to ASBL for any queries after they have are done with their checklist.
Do’s
- Treat the corridor as one connected job market
- Use Knight Frank’s figures as a market snapshot
- Compare locality prices using a current rates guide
- Time the commute at peak hours
- Use the Raidurg metro where it fits
- Judge the home on daily needs and budget
Don’ts
- Assume every node offers the same commute
- Mix different research firms’ totals into one number
- Use the city average as a corridor price
- Assume living in the corridor means a short drive
- Plan around the proposed Phase 2 extension
- Buy mainly on the hope of repeating past growth
Key Takeaways
- Hyderabad’s tech corridor runs from HITEC City and Raidurg through Gachibowli to Nanakramguda and the Financial District.
- In H1 2026, Hyderabad leased 7.5 million sq ft of office space, up 29%, according to Knight Frank.
- The Suburban Business District, including HITEC City and the Financial District, took 60% of that leasing.
- West Hyderabad accounted for 63% of the city’s home sales in the same period.
- Homes followed offices, which explains both the strong demand and the higher prices.
- The city average of ₹8,258 per sq ft does not reflect corridor prices.
- The metro currently ends at Raidurg, and Phase 2 remains a proposal.